
SEO Dashboard Template: 6 Panels, Free to Copy, With Revenue


A good SEO dashboard template fits on one screen and answers three questions in order: how much organic search produced this period (conversions and their value), why it changed (visibility, landing pages, queries), and what you will do next. Below is a free, six-panel template you can copy into Google Sheets or rebuild in Looker Studio, with the formula and data source for every metric.
Most templates that rank for this search are screenshots of traffic charts. This one adds what they leave out: a value column per landing page, a worked example filled in with numbers, the reasons your panels will never agree with each other, and how to keep AI assistant traffic separate from Google.
The SEO Dashboard Template (Copy It)
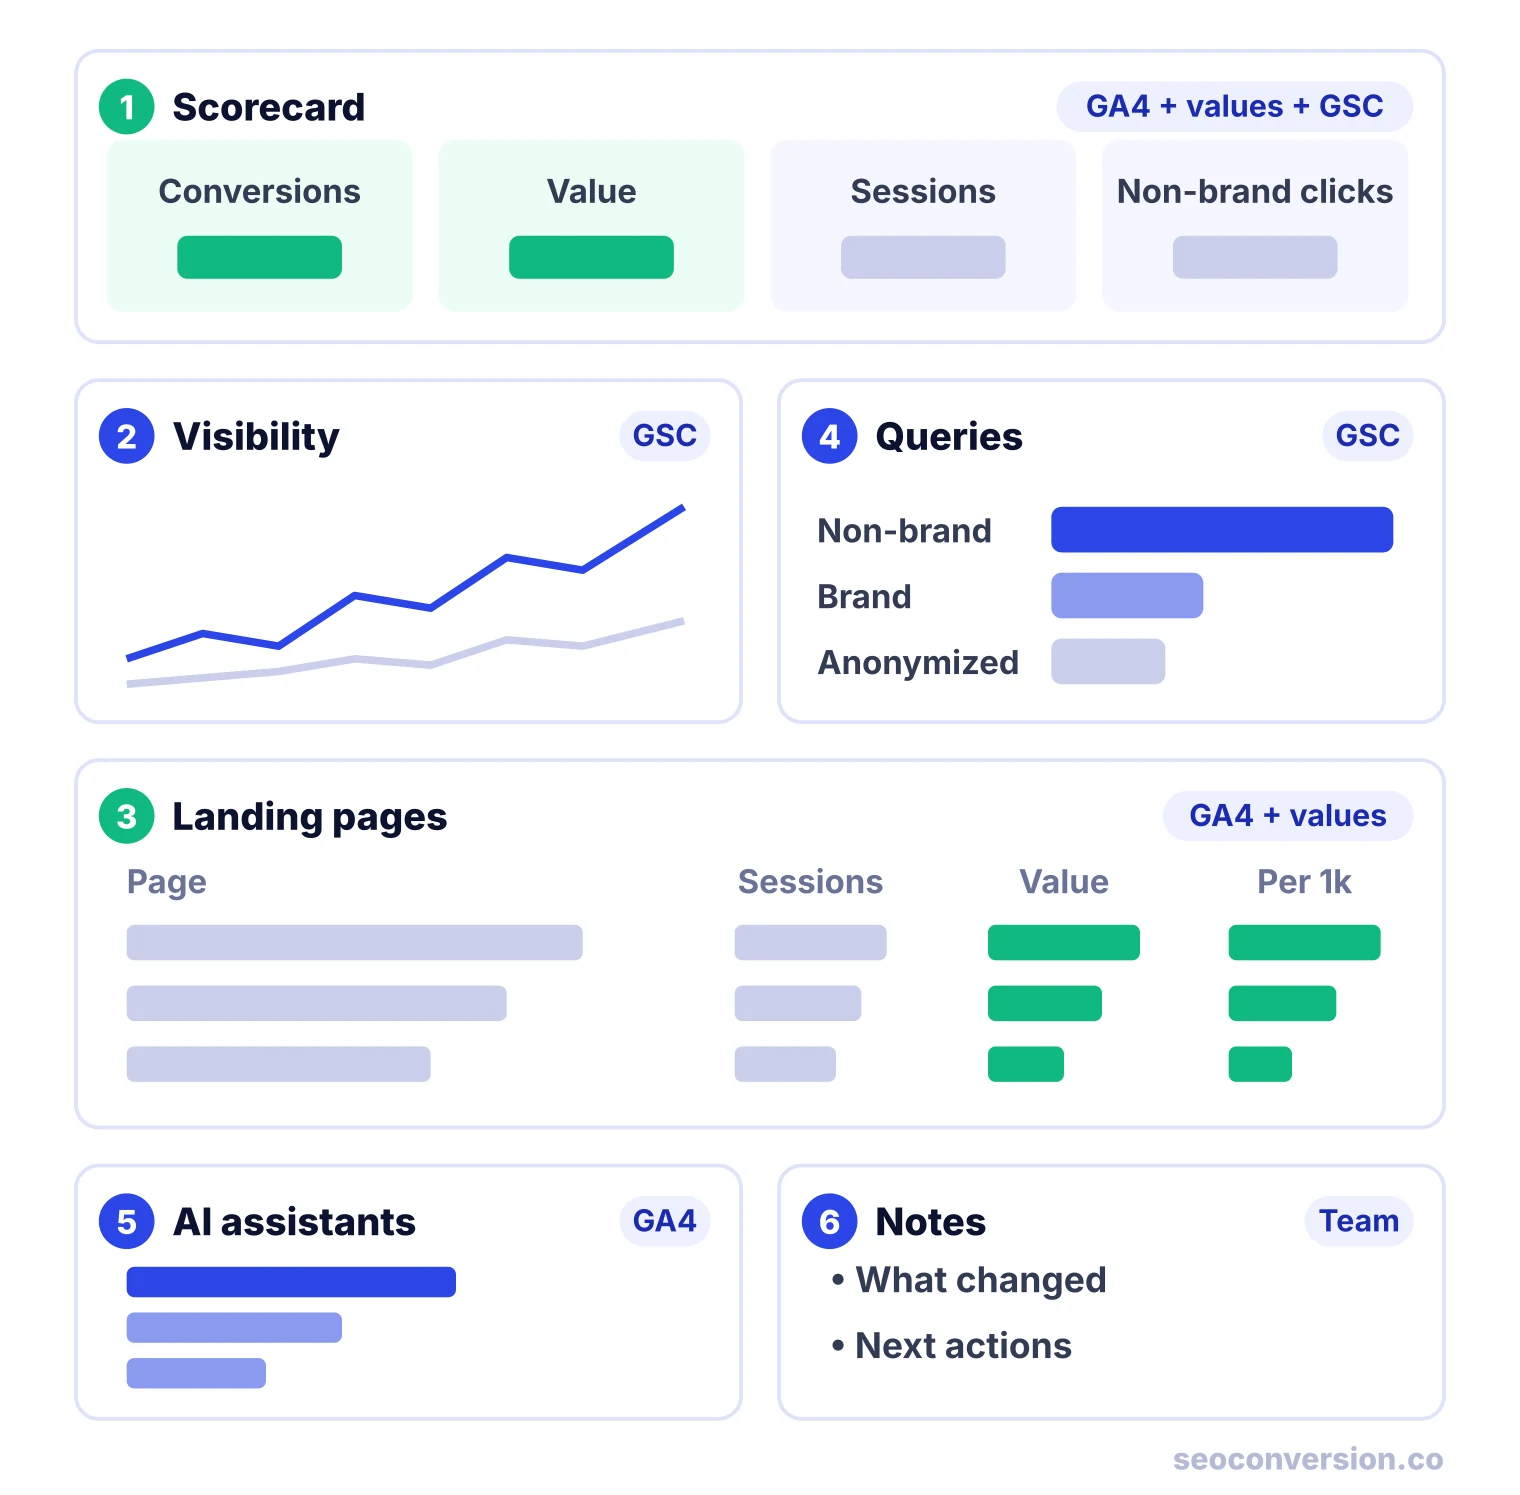
The template has six panels. Read it top to bottom: the scorecard gives the result, panels 2 to 5 explain it, and panel 6 records decisions. Each panel uses at most four or five numbers, so the whole thing stays readable in a two-minute check.
| Panel | What it shows | Source | Question it answers |
|---|---|---|---|
| 1. Scorecard | Organic conversions, organic conversion value, organic sessions, non-branded clicks, each with % change | GA4, value sheet, Search Console | Did organic search produce more this period? |
| 2. Search visibility | Impressions, clicks, CTR and average position as a trend line | Search Console | Is Google showing and choosing us more or less? |
| 3. Landing pages | Organic sessions, conversions, value and value per 1,000 sessions for each landing page or page group | GA4, value sheet | Which pages earn the money, and which only get traffic? |
| 4. Queries | Branded vs non-branded clicks, top rising and falling queries, anonymized remainder | Search Console | Is growth coming from new demand or from people who already know us? |
| 5. AI assistants | Sessions, conversions and value from the GA4 AI Assistant channel | GA4, value sheet | How much do ChatGPT, Gemini and similar tools send, and does it convert? |
| 6. Notes and actions | What changed (releases, Google updates, tracking changes) and next actions with an owner | Your team | What do we do about it? |
Copy the template into Google Sheets
Paste this block into cell A1 of a new sheet, then use Data > Split text to columns with a comma separator. Fill the two period columns each month and compute the change column as (this period − previous period) / previous period.
Panel,Metric,Formula or definition,Source,This period,Previous period,Change
1 Scorecard,Organic conversions,Key events from sessions in Organic Search,GA4,,,
1 Scorecard,Organic conversion value,Sum of (conversions x value per conversion),GA4 + value sheet,,,
1 Scorecard,Organic sessions,Sessions where default channel group = Organic Search,GA4,,,
1 Scorecard,Non-branded clicks,Clicks on queries that do not contain your brand,Search Console,,,
2 Visibility,Impressions,Times a link to your site was shown,Search Console,,,
2 Visibility,Clicks,Clicks from Google results to your site,Search Console,,,
2 Visibility,CTR,Clicks / impressions,Search Console,,,
2 Visibility,Average position,Average position of your topmost result,Search Console,,,
3 Landing pages,Sessions per page,Organic sessions by landing page,GA4,,,
3 Landing pages,Conversions per page,Key events by landing page,GA4,,,
3 Landing pages,Value per page,Conversions x value per conversion,GA4 + value sheet,,,
3 Landing pages,Value per 1000 sessions,Value / sessions x 1000,Calculated,,,
4 Queries,Branded clicks,Clicks on queries containing your brand,Search Console,,,
4 Queries,Non-branded clicks,All other itemized query clicks,Search Console,,,
4 Queries,Anonymized clicks,Chart total clicks - sum of query rows,Search Console,,,
5 AI assistants,AI Assistant sessions,Sessions where default channel group = AI Assistant,GA4,,,
5 AI assistants,AI Assistant conversions,Key events from AI Assistant sessions,GA4,,,
6 Notes,What changed,Releases / Google updates / tracking changes,Team,,,
6 Notes,Next actions,Owner + page + due date,Team,,,
The “value sheet” referenced in the source column is a second tab with one row per conversion type and its value in dollars. The section on revenue below shows how to fill it.
Pick the Audience Before the Metrics
The most common reason an SEO dashboard gets ignored is that it was built for nobody in particular. An executive wants one line of result, an SEO lead wants causes, and a client wants proof that the retainer pays off. Same template, different depth:
| Audience | Panels to show | Cadence | Comparison |
|---|---|---|---|
| Executive or founder | 1 and 6 only, plus panel 3 limited to the top 5 pages by value | Monthly | Year over year, to remove seasonality |
| SEO lead or in-house team | All six panels, with page groups and query filters | Weekly check, monthly review | Previous period and year over year |
| Agency client | 1, 2, 3 and 6, with panel 4 if brand growth is a goal | Monthly report, quarterly review | Previous month and year over year |
| Internal agency overview of many clients | Panel 1 for every client in one table, flagged when value drops | Weekly | Week over week and year over year |
If you can only keep one thing, keep the scorecard plus the notes. A dashboard that shows four numbers and two decisions gets read. One with forty charts gets screenshot once and forgotten.
Which KPIs Belong on an SEO Dashboard
Every metric on the template has a precise definition. Use the ones from the source tool, so anyone can check a number by opening Search Console or GA4.
| KPI | Definition | Why it is on the dashboard |
|---|---|---|
| Organic conversion value | Sum of conversions from Organic Search sessions multiplied by the value of each conversion type | The only KPI that compares directly with what SEO costs |
| Organic conversions | Key events (form submits, calls, purchases, sign-ups) in sessions from Organic Search | Shows results when values are not agreed yet |
| Organic conversion rate | Organic conversions / organic sessions | Separates a traffic problem from a page problem |
| Value per 1,000 sessions | Conversion value / sessions x 1,000, by landing page | Ranks pages by what a visit is worth, not by volume |
| Clicks | Clicks from Google Search results to your site | Demand you actually captured |
| Impressions | How often a link to your site was shown in results | Early signal: rises weeks before clicks do |
| CTR | Clicks divided by impressions | Flags titles, snippets or SERP features stealing clicks |
| Average position | Average position of your topmost result | Direction only: read the trend, not the number |
| Branded vs non-branded clicks | Clicks on queries with and without your brand name | Non-branded growth is the part SEO most directly creates |
The CTR and position definitions come straight from Google’s Performance report documentation. For the brand split, our guide to branded vs non-branded traffic shows how to write the brand filter, including misspellings.
What to leave off
- Bounce rate and pages per session. Older templates still show them. In GA4, bounce rate is simply the inverse of engagement rate, and neither tells you whether organic visitors converted. Use conversion rate instead.
- Total keyword count and “keywords in the top 10”. These grow when you rank for irrelevant terms. Keep rank tracking in its own tool and show its effect through clicks and conversions here.
- Third-party authority scores. Useful for link prospecting, not for judging results. Put them in the optional links module if someone acts on them.
- Single-day numbers. Search data is noisy day to day. Weekly and monthly totals tell the story.
Turn the Dashboard Into Revenue: Value per Landing Page
Traffic dashboards answer “are we visible?” but not “is this worth paying for?”. The fix is one extra column. Give every conversion type a dollar value, then multiply:
Ecommerce sites already have the value: it is the order revenue GA4 records with the purchase. Lead generation sites have to estimate it from their own sales data:
A demo request that turns into a customer 15% of the time, for customers worth $4,000 in their first year, is worth 0.15 × $4,000 = $600 (illustrative numbers). Our guide on how to calculate conversion value covers calls, forms and sign-ups in detail. Then rank landing pages by what a visit is worth:
This number is what makes panel 3 useful. A blog post with 2,000 visits and almost no value tells you to add a path to a money page. A pricing page with few visits and high value tells you where more rankings would pay most. Our landing page conversion rate guide goes deeper on fixing the pages themselves.
Worked Example: One Month Filled In
Here is the template filled in for a fictional B2B software site. All numbers are illustrative. The site tracks two lead types: demo requests valued at $600 (the calculation above) and contact forms valued at $150 (5% become customers worth $3,000).
Panel 1: scorecard
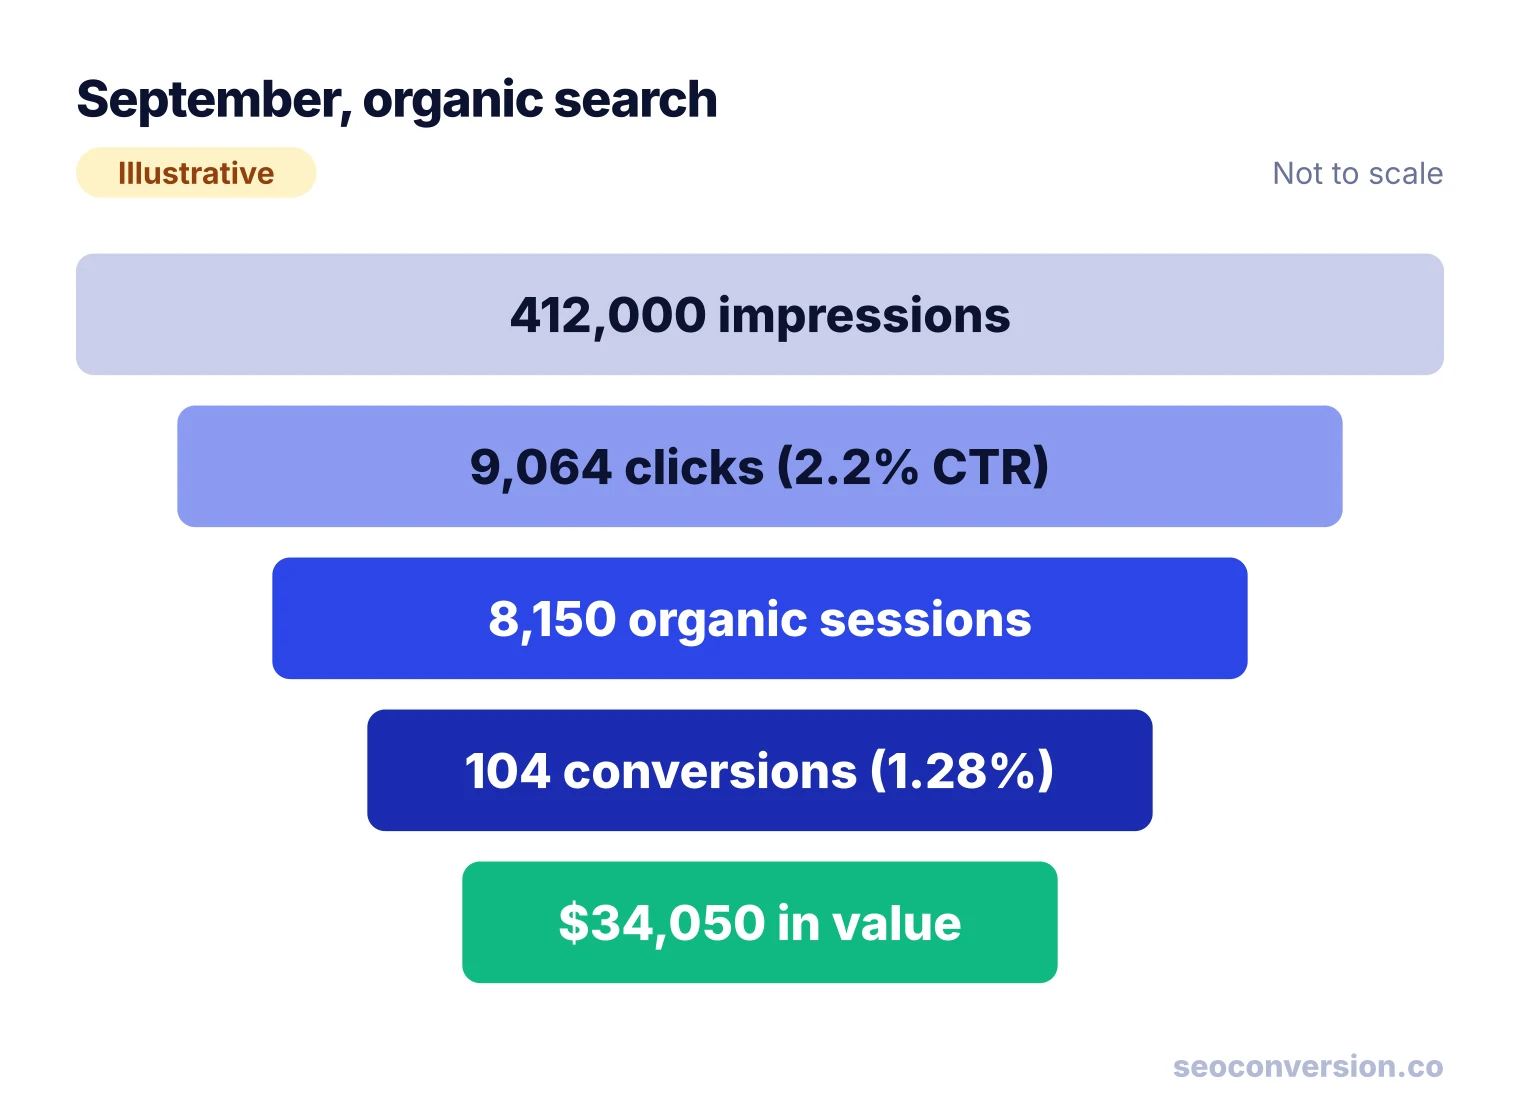
The value: 41 × $600 = $24,600 from demos plus 63 × $150 = $9,450 from contact forms, so $34,050. August was $29,950, so the change is ($34,050 − $29,950) / $29,950 = +13.7%. The conversion rate is 104 / 8,150 = 1.28%.
Panel 2: search visibility
Search Console shows 412,000 impressions and 9,064 clicks, so CTR is 9,064 / 412,000 = 2.2%. Clicks were 8,420 in August, a 7.6% increase. Value grew faster than clicks (13.7% vs 7.6%), which means the new clicks landed on pages that convert better. Panel 3 shows which.
Panel 3: landing pages
| Landing page | Sessions | Demos | Contacts | Value | Value per 1,000 sessions |
|---|---|---|---|---|---|
| /pricing | 610 | 17 | 9 | $11,550 | $18,934 |
| /integrations/shopify | 520 | 6 | 2 | $3,900 | $7,500 |
| /features/reporting | 940 | 9 | 6 | $6,300 | $6,702 |
| /blog/reporting-guide | 2,310 | 4 | 11 | $4,050 | $1,753 |
| /blog/kpi-checklist | 1,480 | 1 | 5 | $1,350 | $912 |
Check one row: /pricing earned 17 × $600 + 9 × $150 = $11,550 from 610 sessions, so $11,550 / 610 × 1,000 = $18,934 per 1,000 sessions. The reporting guide gets almost four times the traffic of /pricing but earns about a tenth as much per visit. The action for panel 6 writes itself: link the guide to /features/reporting and add a demo call to action, rather than chasing more blog traffic.
Panels 4 and 5: queries and AI assistants
The query table lists 7,310 clicks: 1,950 branded and 5,360 non-branded. That is 1,754 fewer than the 9,064 total, because clicks from anonymized queries appear in the total but in no row (explained in the next section). Non-branded is 5,360 / 7,310 = 73% of itemized clicks. In GA4, the AI Assistant channel shows 214 sessions with 2 demos and 3 contact forms: 2 × $600 + 3 × $150 = $1,650, reported next to organic search rather than inside it.
Panel 6: notes and actions
- What changed: new comparison table on /pricing shipped September 4. No tracking changes.
- Action 1: add a demo call to action and a link to /features/reporting in /blog/reporting-guide. Owner: content lead. Due: October 15.
- Action 2: rewrite the title on /blog/kpi-checklist, which has the lowest value per visit. Owner: SEO lead. Due: October 22.
Why Your SEO Dashboard Numbers Never Match
Every SEO dashboard that mixes Search Console and GA4 shows numbers that disagree. That is expected. Put a short note on the dashboard so nobody loses a meeting to it:
| What you see | Why it happens | What to do |
|---|---|---|
| Search Console clicks are higher than GA4 organic sessions | GA4 only counts visits where its tag loads and the visitor is measured. Consent refusals, ad blockers and visitors who leave before the page loads are missing. | Compare trends, not totals. Use clicks for visibility and sessions for conversions. |
| GA4 organic sessions are higher than Search Console clicks | GA4 Organic Search includes Bing, DuckDuckGo and other engines. Search Console is Google only. | Add a source breakdown in panel 1 if Bing matters to you. |
| Query rows add up to less than the total clicks | Anonymized queries, those not issued by more than a few dozen users over two to three months, are left out of tables but kept in chart totals. | Show the gap as its own line (anonymized clicks) instead of hiding it. |
| The landing page or query table is cut off on a large site | The Search Console interface exports up to 1,000 rows. The API and the Looker Studio connector go up to 50,000 rows per day per site per search type. | Use page groups (folders) rather than every URL, or move to the API. |
| Yesterday’s numbers changed | The newest Search Console data can be preliminary and still being collected. | Report complete weeks or months, never the last two days. |
| Branded + non-branded does not equal total clicks | Same anonymized-query effect: any query filter drops them. | Calculate shares from itemized clicks, as in the example above. |
The row and privacy limits are documented by Google in its deep dive on Search Console data filtering and limits. Search engines also hide the query behind each visit from your analytics tool, which is why panel 3 is built on landing pages rather than keywords. Our article on not provided keywords explains the workarounds.
Keep AI Assistants Next to Organic Search, Not Inside It
GA4 now splits AI traffic in two. According to Google’s default channel group definitions, the Organic Search channel includes clicks from Google’s AI Overviews and AI Mode. Visits from ChatGPT, Gemini, Copilot and similar tools go to a separate AI Assistant channel. When an assistant sends no referrer, the visit lands in Direct and no dashboard can attribute it.
That is why the template gives AI assistants their own panel. Mixing them into organic search hides a trend you want to see, and leaving them out undercounts what your content produces. For the setup and what the referrers look like, see our AI conversion tracking guide.
SEOConversion tracks conversions from Google, Bing and AI assistants such as ChatGPT, Perplexity and Gemini, lets you put a value on each conversion, and reports the result by landing page. That covers the conversion and value numbers in panels 1, 3 and 5 without a value sheet. Assistant visits that arrive with no referrer stay Direct: it does not invent attribution it cannot see.
Which Format to Build It In
The template works in any tool. Pick the format by who updates it and who reads it:
| Format | Best for | Live data | Watch out for |
|---|---|---|---|
| Looker Studio | Teams already on Search Console and GA4 who want a free live dashboard | Yes, through Google connectors | Blending GA4 with a value sheet takes some setup; large sites hit row limits |
| Google Sheets or Excel | Small sites, a first version, or anyone who wants full control of formulas | Manual paste, or add-ons and APIs | Someone has to update it; easy to break formulas |
| PowerPoint, Google Slides or Word | Monthly client or board reports | No, a snapshot | It is a report, not a dashboard; keep the same panel order each month |
| Paid BI or reporting tools | Agencies managing many clients and data sources | Yes | Cost per client; check the connector covers conversions, not only traffic |
A common setup is a Looker Studio dashboard for the team and a monthly PDF export of panels 1, 3 and 6 for clients or executives, with the notes written by hand.
How to Build the Template in Looker Studio (6 Steps)
- Connect Search Console. Add your Search Console property as a data source. It feeds panel 2 (visibility) and panel 4 (queries).
- Connect GA4 and filter to Organic Search. Add your GA4 property as a second data source. Create a filter where Session default channel group equals Organic Search, and apply it to panel 1 and panel 3. Make a copy of that filter for AI Assistant and apply it to panel 5.
- Add a value sheet. Create a Google Sheet with two columns, event name and value in dollars, one row per key event. Blend it with GA4 on the event name and add a calculated field: key events × value. Ecommerce sites can use purchase revenue directly.
- Split branded and non-branded queries. In the Search Console source, add a calculated field that returns “Branded” when the query contains your brand names or misspellings (a regular expression works well) and “Non-branded” otherwise.
- Turn on period comparison. Set the default date range to the last full month and enable a comparison period on every scorecard and chart. Add a year-over-year version for executives.
- Add the notes panel and share. Add a text box or an embedded sheet for “what changed” and “next actions”, then share the report or schedule a PDF delivery to the people who need it.
Before trusting the numbers, check that your key events actually fire. A dashboard built on missing conversions looks fine and is wrong. Our SEO conversion tracking guide covers that setup end to end.
Optional Modules: Technical, Links and Local
Many templates add these sections. Include one only when someone on the team acts on it every month, and put it below panel 6 so it does not crowd the result.
- Technical health. Indexed pages, crawl errors and Core Web Vitals pass rates for mobile and desktop. Useful during a migration or a site rebuild.
- Links. New and lost referring domains per month. Show it if you run outreach; a falling count is worth a weekly look.
- Local. Google Business Profile calls, website clicks, direction requests and review count by location. Essential for multi-location businesses, where these actions are often the main conversion.
- Content groups. Panel 3 rolled up by folder or topic cluster (/blog/, /features/, /integrations/) so a large site stays readable.
FAQ
Is there a free SEO dashboard template?
Yes. The template on this page is free: copy the CSV block into Google Sheets or rebuild the six panels in Looker Studio, which is also free and has connectors for Search Console and Google Analytics 4. Many vendors also publish free Looker Studio templates, but check that they include conversions and value, not only traffic.
Can I make an SEO dashboard template in PowerPoint or Word?
You can, but it will be a static report rather than a dashboard. Use the same six panels as slide or page sections, paste the numbers in each month, and keep the comparison column. If the file goes to a client or an executive every month, a live Looker Studio report with a PDF export is usually less work.
What should an SEO dashboard include?
At minimum: organic conversions and their value, organic sessions, Search Console clicks, impressions, CTR and position, a landing page table, a branded vs non-branded split and a notes row. Add AI assistant traffic, backlinks, technical health or local metrics only when someone acts on them.
What is the difference between an SEO dashboard and an SEO report?
A dashboard is a live view that updates on its own and is checked often, usually weekly. A report is a snapshot for a period, usually monthly, with commentary on what changed and what happens next. Most teams build the dashboard first and export it, plus a notes section, as the report.
How often should I check an SEO dashboard?
Weekly for the scorecard and the notes, monthly for landing pages and queries, and quarterly for year-over-year trends. Search data moves slowly and daily numbers are noisy, so looking every day mostly creates false alarms.
Why do Search Console clicks not match GA4 organic sessions?
They count different things. Search Console counts clicks on Google results, while GA4 counts sessions from all search engines, and only when its tag loads and the visitor is measured. Consent banners, blocked scripts and quick bounces lower GA4, while Bing, DuckDuckGo and other engines raise it.
Put dollars on your SEO dashboard.
SEOConversion tracks conversions from Google, Bing and AI assistants, lets you assign a value to each one, and reports the result by landing page.
Start free