
SEO KPI Dashboard: What to Track, How to Build It, How to Read It


An SEO KPI dashboard is one report that tracks a small set of organic search indicators against targets. The useful ones put business outcomes at the top (organic conversions and what they are worth), then the metrics that explain them: organic sessions by landing page, Search Console clicks, impressions and CTR, and site health. If your dashboard starts with rankings and ends with traffic, it tells you what happened in Google, not whether SEO paid off.
This guide gives you the KPI list with definitions and sources, a five-step build, examples for different audiences, a worked example that turns organic traffic into dollars by landing page, and a decision tree for when a number drops.
What an SEO KPI Dashboard Is (and What It Is Not)
A metric is any number you can measure: impressions, bounce rate, word count, backlinks. A KPI is a metric tied to a goal, with a target and someone who owns it. An SEO dashboard often shows dozens of metrics. An SEO KPI dashboard shows the few that decide whether the SEO program is working, and arranges everything else as explanation.
That distinction matters because most SEO numbers are inputs. Impressions can rise while revenue falls. Average position can improve on keywords nobody buys from. The dashboard’s job is to show the outcome first, so every other number is read in light of it.
- Dashboard vs report: a dashboard is live and answers “how are we doing now.” A report is a snapshot for a period with commentary. You build the report from the dashboard.
- Dashboard vs template: a template is a layout you copy. The KPIs, targets and filters in this guide are what you put in it.
The KPIs That Belong on an SEO KPI Dashboard
Group KPIs in four tiers, read from the top down. Outcomes say whether SEO produced business. Traffic says how many people organic search sent and where they landed. Visibility says how Google showed you. Health says whether the site can be crawled, indexed and used. Copy the table below into a sheet and delete the rows that do not fit your business.
| Tier | KPI | Definition or formula | Source | Review |
|---|---|---|---|---|
| 1 Outcomes | Organic conversion value | Revenue plus lead value from conversions in Organic Search sessions | Conversion tracking or GA4 | Monthly |
| 1 Outcomes | Organic conversions | Key events (purchases, leads, sign-ups) from Organic Search sessions | Conversion tracking or GA4 | Weekly |
| 1 Outcomes | Organic conversion rate | Organic conversions ÷ organic sessions | GA4 | Monthly |
| 1 Outcomes | AI assistant conversions | Conversions from ChatGPT, Gemini, Copilot and similar referrals | GA4 AI Assistant channel or tracker | Monthly |
| 2 Traffic | Organic sessions | Sessions in the Organic Search channel, split branded vs non-branded where possible | GA4 | Weekly |
| 2 Traffic | Converting landing pages | Organic landing pages with at least one conversion in the period | GA4 or tracker | Monthly |
| 3 Visibility | Clicks | Clicks from Google Search results to your site | Search Console | Weekly |
| 3 Visibility | Impressions | Times your site appeared in Google results | Search Console | Weekly |
| 3 Visibility | CTR | Clicks ÷ impressions | Search Console | Monthly |
| 3 Visibility | Average position | Average position of your topmost result, per page or query group | Search Console or rank tracker | Monthly |
| 4 Health | Indexed pages | Important pages indexed vs submitted in the sitemap | Search Console page indexing | Weekly |
| 4 Health | Core Web Vitals | Share of URLs rated good on mobile and desktop | Search Console | Monthly |
| 4 Health | Decay list | Pages with stable impressions but falling clicks or conversions | Search Console + GA4 | Monthly |
Which ones to put in the top row
The top row should hold one to three numbers that leadership already cares about. For a store, that is organic revenue. For a lead business, organic leads and their value. For a SaaS, trials or demo requests. Everything else sits below and is there to explain movement in that row.
The splits that make each KPI useful
- Branded vs non-branded. Branded searches mostly reflect demand you already created. Non-branded growth is what SEO work earns. See branded vs non-branded traffic for how to split it.
- By landing page. Search engines hide most keyword data in analytics, so the landing page is the unit where traffic, conversions and value meet.
- Date comparison. Always against the same period last year, plus the previous period for fast checks.
- Device and country. A mobile-only drop points to a template or speed problem; a single-country drop points to a local SERP change.
Where Each Number Comes From
No single tool holds the whole dashboard. Each tier has a natural source, and most of the confusion about SEO numbers comes from mixing them without knowing what each one counts.
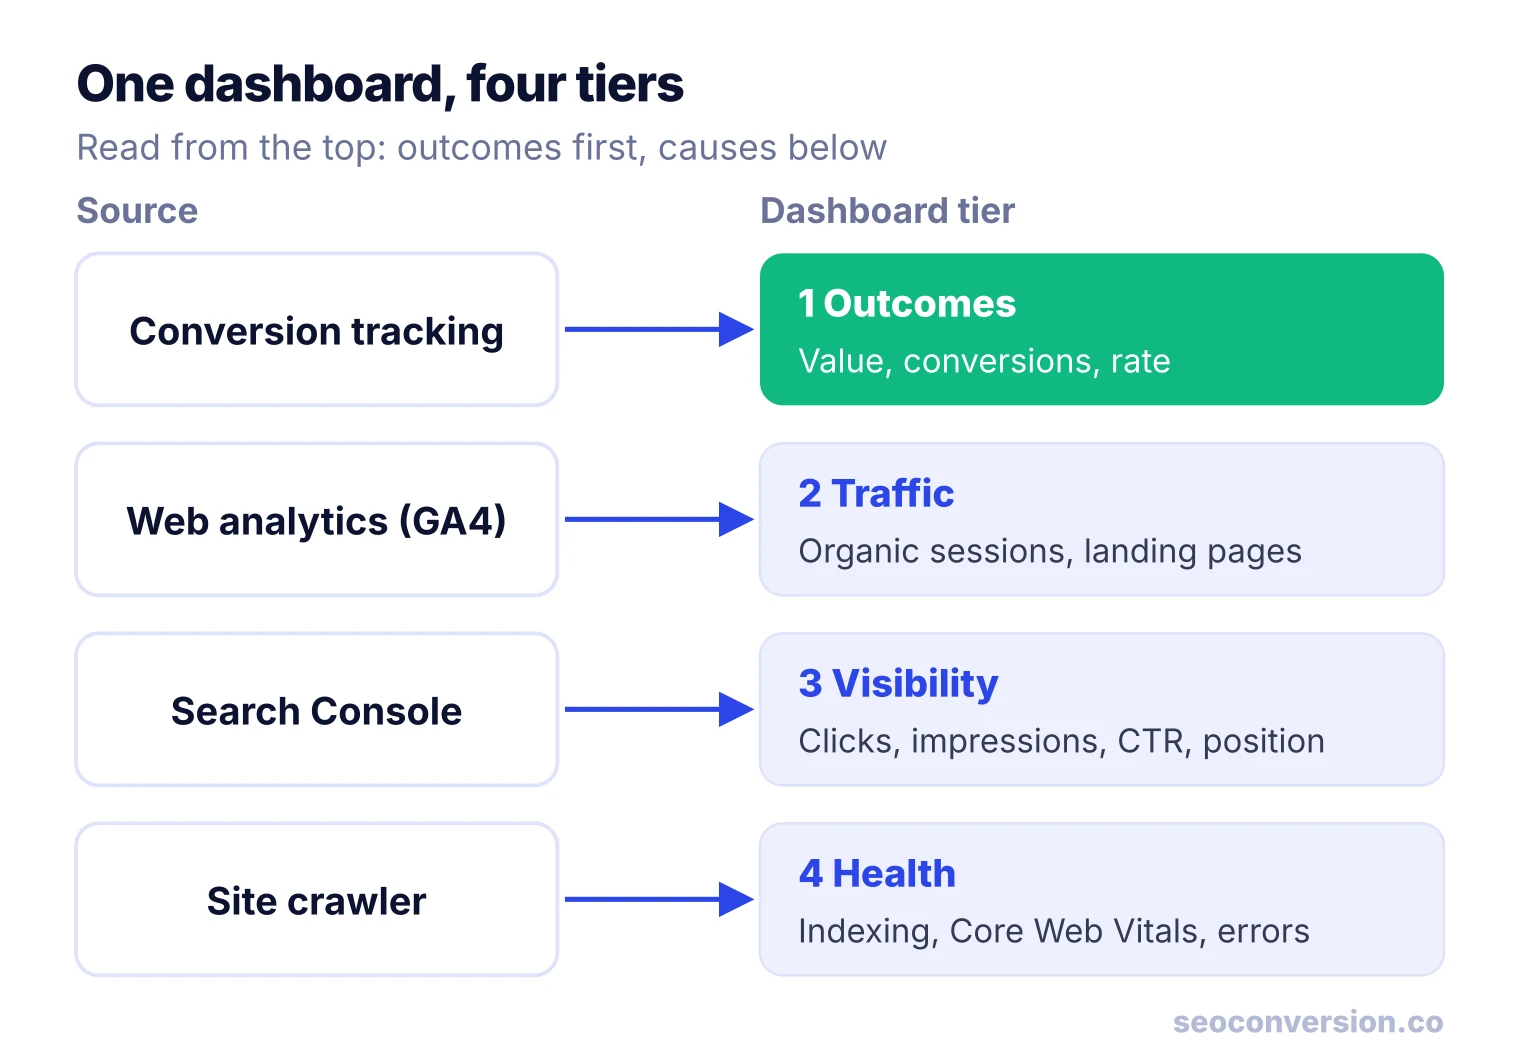
- Conversion tracking for outcomes: GA4 key events, ecommerce purchase data, or a dedicated conversion tracker. Whatever you use, each conversion needs a value. If you do not have one yet, see how to calculate conversion value.
- Web analytics (GA4) for organic sessions and landing pages. In GA4’s default channel group, Organic Search includes clicks from Google’s AI Overviews and AI Mode, while referrals from ChatGPT, Gemini, Deepseek, Copilot or Grok go to a separate AI Assistant channel.
- Search Console for visibility. Its Performance report defines clicks as clicks from Google Search results, impressions as times your site appeared, CTR as clicks divided by impressions, and average position as the average position of your topmost result. Its page indexing and Core Web Vitals reports also cover much of the health tier.
- A site crawler for the rest of health: broken links, redirect chains, missing titles, orphan pages.
- A rank tracker (optional) for daily positions on a fixed keyword set, which Search Console’s averages smooth out.
Which Tool to Build It In
| Tool | Good for | Watch out for |
|---|---|---|
| Looker Studio | Free, native Google Analytics and Search Console connectors, easy sharing | Slow with many blended sources; Search Console query tables hide some queries |
| Power BI or Tableau | Teams that already run BI, heavy blending with CRM and finance data | Needs connectors or exports for Search Console and GA4, more setup |
| SEO suite dashboards | Rank tracking, visibility scores, competitor views, local SEO | Rankings and estimated traffic, rarely your own conversions |
| Spreadsheets | Small sites, monthly snapshots, full control | Manual refresh, easy to break, no drill-down |
For agencies with several clients, the Looker Studio Search Console connector supports data controls, so viewers can switch the account behind one report instead of you maintaining a copy per client. The same connector offers a Site Impression table (whole property) and a URL Impression table (page level). Use the URL table for the landing page views in this guide.
How to Build an SEO KPI Dashboard in 5 Steps
Step 1: Pick the one outcome SEO is judged on
Ask whoever funds SEO what result they expect it to move. Write it down as a conversion: purchase, qualified lead, demo request, trial, booked call. Give each type a value, even an estimate, so different conversions add up in one currency.
Step 2: Choose KPIs for each tier
One to three outcome KPIs, two or three traffic metrics, the four Search Console visibility metrics and a short health list. If you cannot say which decision a metric informs, leave it off the first page.
Step 3: Connect the sources
Connect GA4 and Search Console to your dashboard tool, then your conversion data. Check that the totals in the dashboard match each tool’s own interface for the same date range before you build anything on top.
Step 4: Lay it out top down, with filters
Row 1: outcome scorecards with change vs last year. Row 2: organic sessions trend and a landing page table with sessions, conversions, conversion rate and value. Row 3: Search Console clicks, impressions, CTR and position. Row 4: health. Add filters for date comparison, device, country and branded vs non-branded.
Step 5: Set targets, owners and a review rhythm
A KPI without a target is a metric. Base targets on the same period last year so seasonality is built in:
Illustrative example: 300 organic conversions last Q2 and a planned 15% growth give a Q2 target of 300 × 1.15 = 345. Name one owner per KPI. Review visibility and health weekly to catch breakage, outcomes monthly, and the KPI list itself each quarter. Set alerts for the breakages that cost the most, like conversions dropping to zero, which usually means a broken tag or form.
SEO KPI Dashboard Examples by Audience
The same data supports different first pages. Pick by who reads it:
| Dashboard | Reader | First-page KPIs |
|---|---|---|
| Executive | Founder, CMO, client | Organic conversion value, conversions, trend vs target, top 5 landing pages by value |
| SEO manager | In-house SEO lead | All four tiers with filters, branded vs non-branded, decay list |
| Content | Editors, writers | Sessions and conversions by article, CTR by page, pages losing clicks |
| Ecommerce | Store owner, merchandisers | Organic revenue, transactions and average order value by landing page and category |
| Local SEO | Multi-location business | Calls, form leads and direction requests by location, local pack visibility |
| Agency | Account managers, clients | The executive view per client, same KPI set across accounts, account switcher |
Put Money on the Dashboard: A Worked Example
Traffic share and value share are rarely the same thing. Here is a B2B site with three organic landing pages in one month. The numbers are illustrative, and the lead value assumes 20% of demo requests close at $2,000 in first-year revenue, so one demo request is worth $400. A newsletter sign-up is valued at $20.
| Landing page | Organic sessions | Conversions | Value | Value per session |
|---|---|---|---|---|
| Pricing page | 1,200 | 36 demos | $14,400 | $12.00 |
| Integration page | 2,400 | 24 demos | $9,600 | $4.00 |
| Blog guide | 9,000 | 6 demos + 45 sign-ups | $3,300 | $0.37 |
| Total | 12,600 | $27,300 | $2.17 |
The blog guide’s value is 6 × $400 + 45 × $20 = $2,400 + $900 = $3,300. It brings 71% of organic sessions (9,000 ÷ 12,600) but 12% of the value ($3,300 ÷ $27,300). The pricing page brings 10% of sessions and 53% of the value. A traffic-only dashboard would tell you the blog guide is your best SEO asset. The value view says protecting and improving the pricing and integration pages matters more, and that the guide needs a better path to a demo.
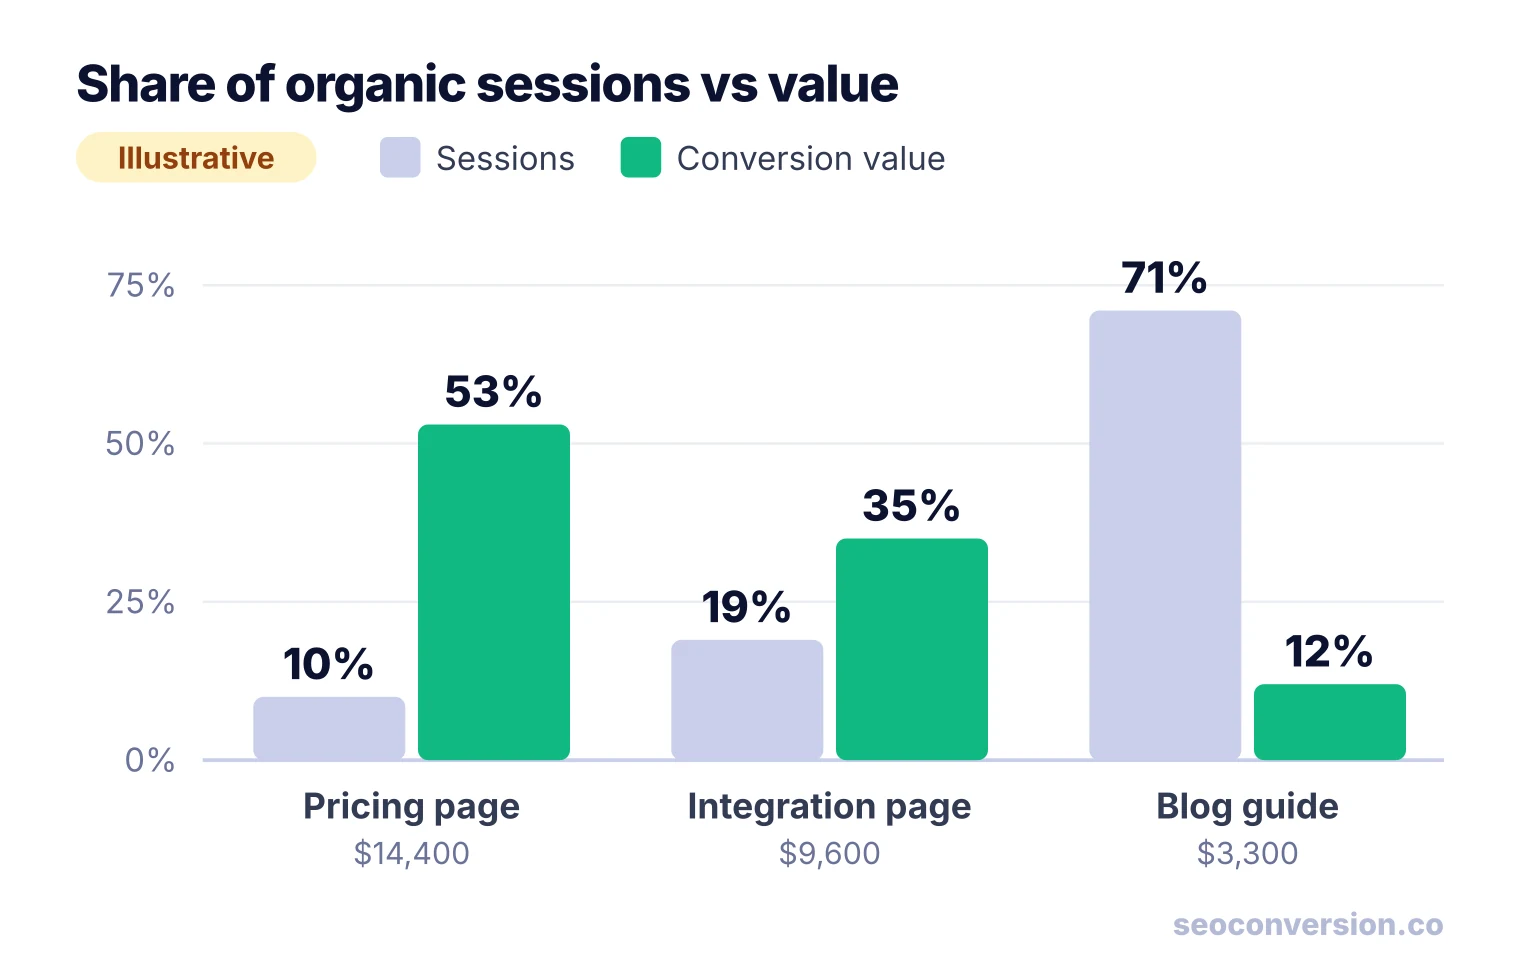
This view needs conversions attributed to the organic landing page where the visit started. For the mechanics, see organic revenue and the SEO conversion tracking guide. SEOConversion reports conversions and their value by landing page for organic search and AI assistants, which is this table without the spreadsheet work.
Add AI Search Without Guessing
Many SEO dashboards now add an AI section. Keep it to what you can measure on your own site:
- Google AI Overviews and AI Mode clicks already count as Organic Search in GA4, so they do not appear as a separate line there. Treat them as part of your organic numbers.
- ChatGPT, Gemini, Copilot and similar show up in GA4’s AI Assistant channel when they pass a referrer. Put their sessions and conversions next to organic in the outcome tier. See AI traffic analytics for the setup.
- Visits with no referrer land in Direct. Some AI traffic hides there, and no tool can assign it with certainty. A rise in Direct to deep pages is a hint, not a number; see what direct traffic means.
- “Citation” or “AI visibility” scores from third-party tools sample prompts. Treat them as a diagnostic like rank tracking, never as an outcome KPI.
Why Your Dashboard Numbers Disagree
The first week with a new dashboard usually ends with someone asking why Search Console says one thing and GA4 another. They count different things:
| What you see | Why | What to do |
|---|---|---|
| GSC clicks ≠ GA4 organic sessions | GSC counts clicks from Google Search only. GA4 Organic Search also includes Bing and other engines, and only counts visits where the tag loaded and consent allowed it. | Compare trends, not totals. Filter GA4 to google / organic when comparing. |
| Query table total < site total | Search Console hides some queries to protect privacy, per the Looker Studio connector docs. | Use site or page totals for KPIs, queries for diagnosis only. Filter blank query rows. |
| Last few days look low | The newest Search Console data can be preliminary and still changing. | Leave the most recent days out of weekly comparisons. |
| Average position worsened while clicks rose | Position is an average of your topmost result across every query. Ranking for many new long-tail queries at lower positions pulls the average down. | Read position per page or query group, never site-wide alone. |
| Rank tracker ≠ Search Console position | Trackers check one location and device at a set time; Search Console averages real impressions. | Use the tracker for direction on a fixed keyword set. |
| Organic conversions differ between tools | Different attribution (last click vs data-driven), counting methods and blocked tags. | Pick one source for the outcome tier and stick to it. |
When a KPI Drops: Read the Dashboard Top Down
A dashboard earns its keep the day a number falls. Start at the outcome and walk down one tier at a time. Each “no” tells you where the cause lives, so you stop guessing.
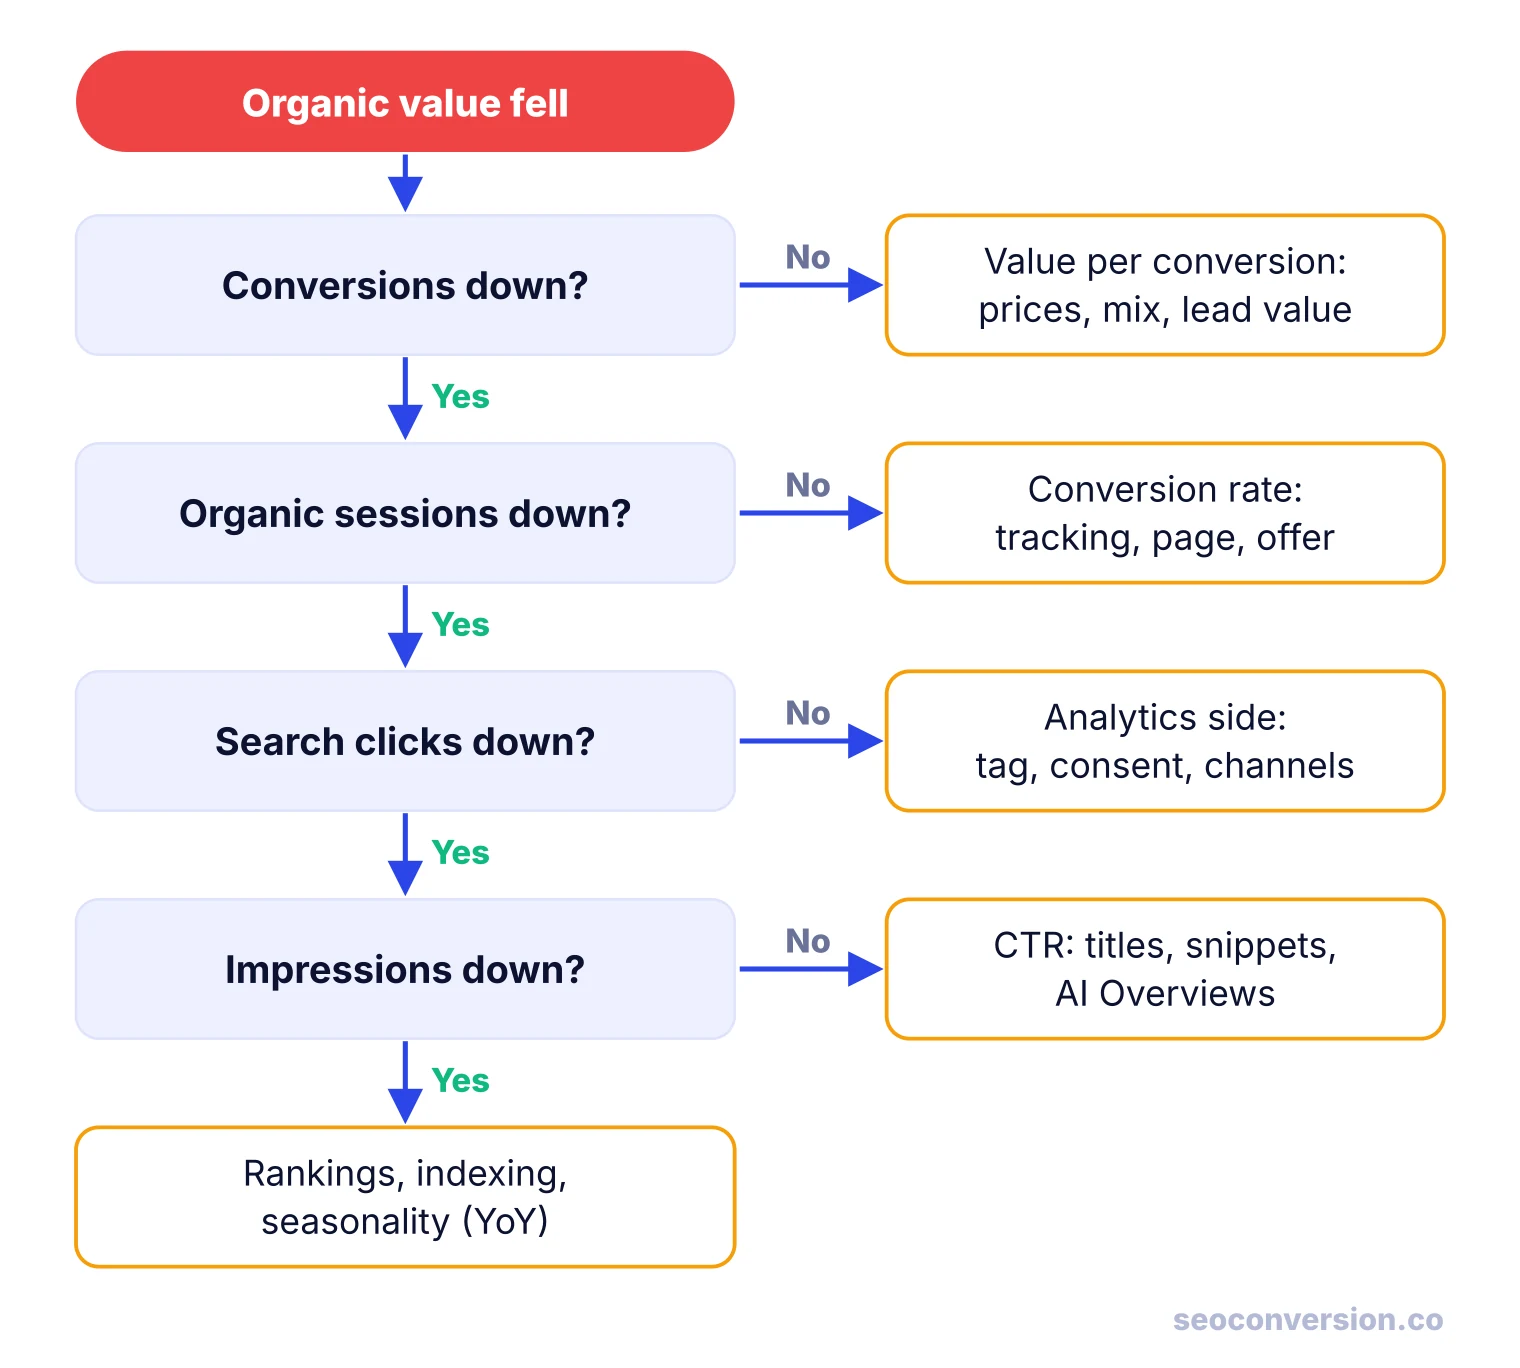
- Conversions steady, value down: the problem is value per conversion. Check prices, product mix, discounting or a changed lead value.
- Conversions down, sessions steady: conversion rate fell. Test the form or checkout first, then look for page or offer changes. See landing page conversion rate.
- Sessions down, Search Console clicks steady: the analytics side changed: a removed tag, a new consent banner, or channel rules moving traffic elsewhere.
- Clicks down, impressions steady: CTR fell. Look at title or snippet changes and new SERP features such as AI Overviews on your main queries.
- Impressions down: visibility fell. Check rankings per page, indexing errors and the same period last year for seasonality. Pages that slide slowly belong on the decay list; see content pruning for what to do with them.
Jumping straight to rankings. Half of the branches above have nothing to do with Google: a broken form or a tag removed during a site release can look exactly like an SEO decline at the top of the dashboard.
FAQ
What are the most important SEO KPIs?
Start with organic conversions and their value, because they show whether search produces business. Then organic sessions by landing page, Search Console clicks, impressions and CTR, and a short health list (indexing and Core Web Vitals). Rankings are useful for diagnosis but make a weak headline KPI on their own.
How many KPIs should an SEO dashboard have?
Few enough that someone can read the top row in under a minute: one to three outcome KPIs, then a handful of supporting metrics below. Keep the first page short and move everything else to drill-down pages. If a number never changes a decision, remove it.
Is there a free SEO KPI dashboard?
Yes. Looker Studio is free and has native connectors for Google Analytics and Search Console, so you can build the four tiers in this guide without paying for software. Many free templates exist for it. Paid SEO suites add rank tracking and competitor data, and a conversion tracker adds outcome data that GA4 alone may not capture well.
How often should you review an SEO KPI dashboard?
Glance at visibility and health weekly to catch breakage, such as a deindexed section or a broken form. Judge outcomes monthly and against the same period last year, because SEO moves slowly and many businesses are seasonal. Quarterly is the right rhythm for changing targets or the KPI list itself.
Can ChatGPT do an SEO audit?
Partly. It can review content, titles, schema or a crawl export you paste in, and it is good at spotting thin sections or unclear headings. It does not see your Search Console data, your conversions or your full site unless you give it exports, and its suggestions need checking. Use it as an assistant for the health tier, not as the dashboard.
What is the difference between an SEO dashboard and an SEO report?
A dashboard is a live view that updates on its own and answers “how are we doing right now.” A report is a snapshot for a period, usually with commentary on what changed, why, and what happens next. Most teams build the dashboard first and write the monthly report from it.
Put organic conversions at the top of your dashboard.
SEOConversion tracks conversions from Google, Bing and AI assistants, lets you assign a value to each one, and reports conversions and value by landing page.
Start free